Problem
As you begin to work with SQL Server Reporting Services, you find may the need to utilize some more advanced options for cells and textboxes that get dropped onto Tablixes. What options are available? Check out this tip to learn more.
Solution
SQL Server Reporting Services (SSRS) offers several different options for working with textboxes on a report. Some of these options include the following three items:
- Adding multiple textboxes to a single cell on a tablix.
- Adding a chart or graph to a tablix.
- Special formatting options and adding line feed / carriage returns.
Let's take a look at examples of each.
Multiple Textboxes in a single cell of a SQL Server Reporting Services Report
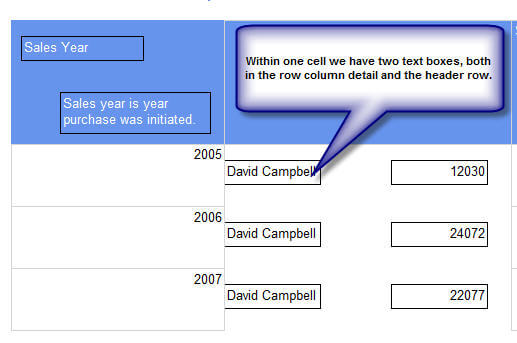
It may seem counter intuitive, but SSRS provides the functionality to add multiple textboxes into a single cell on a Matrix. Several reasons exists for wanting to embed these multiple textboxes. First, in the header rows or columns, it can be beneficial to space out the certain text or even images onto specific parts of an individual cell or it may be helpful to have two distinct records under a single column header. Displaying a sparkline or chart immediately next to a numeric value is also another valid reason (this process will be covered in the next section below). So how can multiple textboxes be added to a single cell. I will be using the AdventureWorks database and some related reports to demonstrate these tips.
Step 1 is to drag the Rectangle Object into a cell.
Step 1 is to drag the Rectangle Object into a cell.
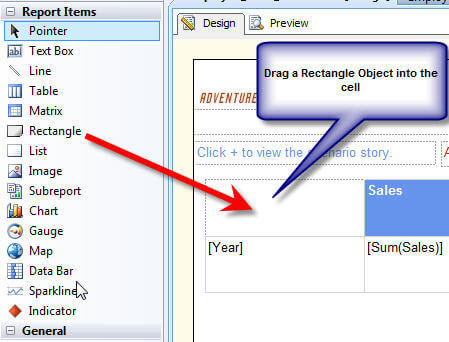
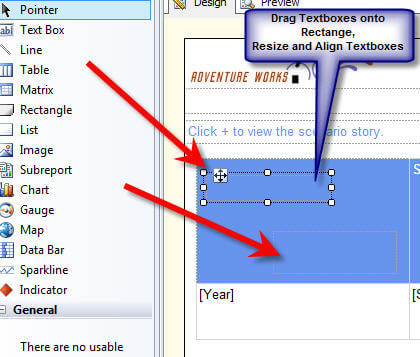
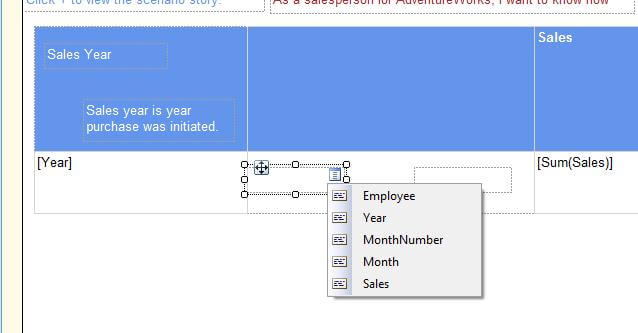
Step 2 is to drag multiple textboxes onto the Rectangle object. Then resize the individual textboxes as needed. Also, "text" can be added to the textboxes as in the example below, or if within the data area, individual fields can be added.
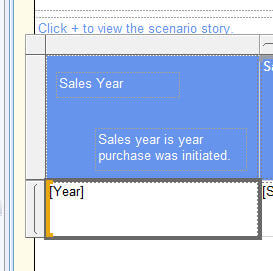
The end result is multiple textboxes each with its own border, but contained within a single cell.
Charts and Sparklines within a textbox or Cell of an SSRS Report
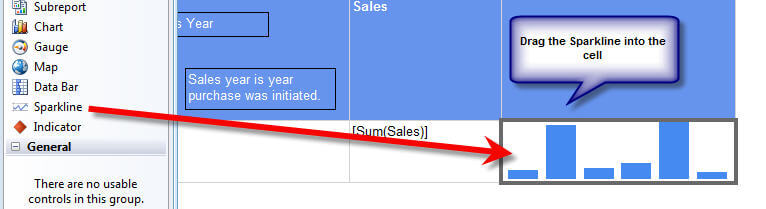
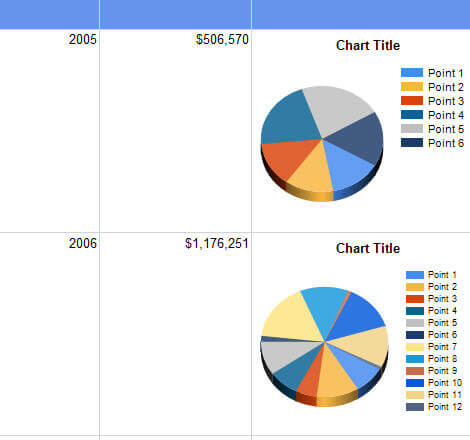
This next tip may also appear counter intuitive, but charts and sparklines can be added to one cell within a tablix row, which produces a succinct chart just for the particular row group. For example, we may want to see sales broken out by store; however, we may also want to see a trended monthly sales line chart for each of the respective stores.
This first step in this process is to drag a chart or sparkline object to the cell.
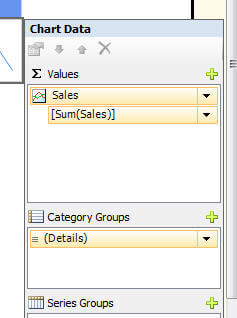
Next, add the Sparkline Properties for the values and groups.
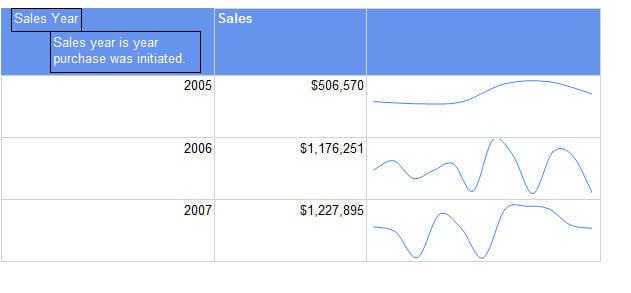
The end result is a report which displays not only current sales, but also a trended graph showing the sales trend. Of course, you can utilize other charts instead of a line chart. As displayed in the second figure below, pie charts create an excellent breakout for each category for a given group, which in turn means you would not have to create a separate chart for each group. That is quite handy!
Special formatting and Carriage Returns in SQL Server Reporting Services
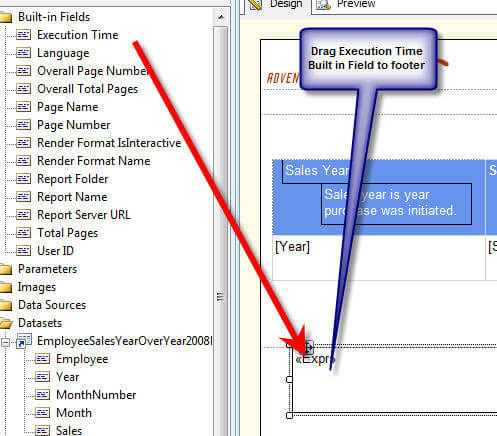
By the nature of using SSRS, we are wanting to present our data in a nice, "formatted" structure, otherwise we would just run a query and work with the results. SSRS does a great job of handling basic formatting within a cell that has just a single field. However, what happens if for instance you are concatenating two fields of different data types into one textbox? Often times this situation occurs when displaying a report run date which you would like to display as "Report Run Date: 05/13/2013" (not including the time). Which standard format do you use for that textbox? The answer is to use the SSRS formatting function to format each piece of the concatenated expression in the cell. To accomplish this process, first drag the Execution Time Built In Field to the footer.
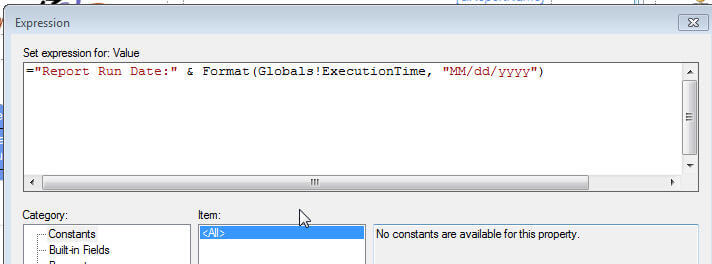
Next, right click on the textbox and select Expression. Adjust the expression to read as follows.
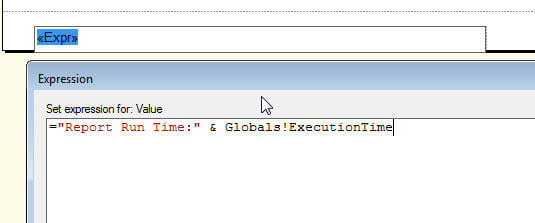
The footer with the current expression displays as follows.
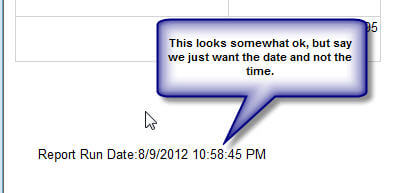
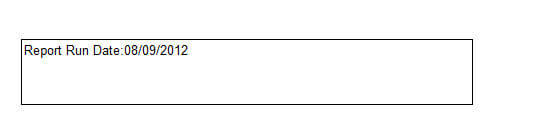
However, if we only want the date to show (and not the time), we can not just format the textbox with a short date format because of the "Report Run Date" string. Fortunately, we can use the Format function to actually apply the date format to just the 2nd part of the expression. The new expression syntax is displayed below.
The footer now displays only the date. For more information on SSRS Expressions including the format function, see Expression Examples on MSDN: http://msdn.microsoft.com/en-us/library/ms157328.aspx .
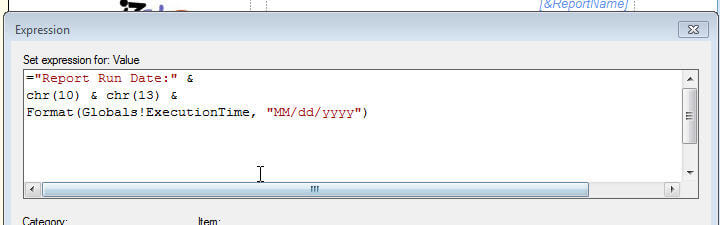
Using this same textbox, say that we want to have the date appear on the line below the "Report Run Date:" expression. As noted in the below example, we can insert "chr(10) & chr(13)" into our expression which instructs SSRS to insert a carriage return / line feed into the textbox upon rendering.
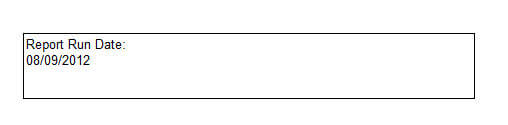
Now the date appears on line 2 in the below figure. Inserting a line feed is often handy for titles in the header and footer area of a report.
Next Steps
- In this tip, a sundry list of textbox tips were featured. Textboxes can be used for charts and graphing; they can also be split apart using the rectangle object which includes drag and drop functionality for multiple textbox to be added to the rectangle. Last, formatting of textboxes can be defined not only for the entire textbox, but also for individual items within a textbox expression.
- Additional Formatting Examples: http://sql-bi-dev.blogspot.com/2010/09/ssrs-expressions.html
- SSRS Conditional Formatting: http://www.mssqltips.com/sqlservertip/1586/sql-server-reporting-services-conditional-formatting/
- Check out this SSRS Tutorial.
No comments:
Post a Comment